Why a Single Unified Task Report Is a Trap (and What to Build Instead)
Building a unified ServiceNow task report across Incident, RITM, Change Request, and Problem? Use active=true - not state=1, which maps to different statuses on every table. Keep Task-SLA out of the same report or your row counts will inflate. For volume by team, a single Task [task] report grouped by assignment_group works. For executive views with trend lines, use a Performance Analytics dashboard with one widget per task type. For request fulfillment, always report on RITM, not REQ.

A single view of all open work across incident, request, change, and problem is one of the most commonly requested ServiceNow reports. It sounds straightforward. In practice, the data model makes it more nuanced than most people expect, and the most natural approach will produce numbers that mislead leadership without anyone realizing it.
This article walks through exactly where those traps are, how to avoid them, and what to build instead.
Why a Unified Task Report Breaks in Practice
All four work types (Incident, RITM, Change Request, and Problem) inherit from the Task [task] table. That makes a cross-table report technically possible. But each child table extends Task with its own state values, assignment model, and SLA relationships, and that is where the problems start.
Notice that Change Request uses negative integers for its active workflow states, and Problem uses an entirely separate 100-series scheme. This is the core reason why filtering on a shared state value across task types will always produce wrong results.


These values reflect default out-of-box configurations. Verify against your instance by navigating to System Definition > Choice Lists and filtering by table name. Change state values in particular vary depending on which change model is in use and whether custom states have been configured.
Filtering on state=1 across all task types without accounting for this will produce a report that misrepresents how much is actually open. A Draft change and a New incident look identical in the query but mean completely different things operationally.
Row multiplication from Task-SLA joins. If you join Task to Task-SLA to get breach data in the same report, you will get one row per SLA record rather than one row per task. A task with three SLAs attached produces three rows where there should be one. The counts will look inflated, and they will be.
The RITM vs. REQ Distinction
One commonly missed trap when building this report: sc_req_item (RITM) and sc_request (REQ) are separate tables that count different things.
REQ is the parent request submitted by a user. RITM is the fulfillable line item that gets routed to a team. One REQ can contain multiple RITMs. Counting open RITMs tells you how many fulfillment items need to be worked. Counting open REQs tells you how many user-submitted requests are unresolved. These are not interchangeable, and mixing them in a unified view will produce confusion.
For a "how much work is open" dashboard, RITM (sc_req_item) is almost always what you want. REQ belongs in a separate service consumption view.
Now that the traps are clear, here is when the Task report is actually the right choice and how to build it correctly.
Building the Task-Table Report: What It's Actually Good For
Reporting directly on the Task table works well when you need volume counts and a simple breakdown by type. It is the right starting point for high-level dashboards showing total open work by assignment group, grouped by sys_class_name.
Here is how to actually build it in Report Designer.
Navigation: All > Reports > Create New
Set the following:
- Table: Task [task]
- Type: List (for drill-down) or Bar Chart (for leadership dashboards)
- Condition: active=true^sys_class_nameINincident,sc_req_item,change_request,problem
Use active=true rather than a specific state value. Active is a standard boolean field on the Task table managed by each child table's own state logic. It is the most reliable way to express "this record is not yet complete or cancelled" across all four types.
Columns to add:
- Number (task identifier for drill-through)
- Short description (readable context)
- sys_class_name (visible type label: Incident, RITM, etc.)
- Assignment group (who owns the work)
- Priority (for filtering by urgency)
Grouping and stacking: In the Report Designer's Group By section, set Group by: Assignment group and Stack by: sys_class_name. This gives you a per-team breakdown of work type distribution without requiring separate queries.
If you need to exclude specific states (on-hold changes, pending problems), add those as explicit exclusions per class rather than a blanket filter:
active=true^sys_class_nameINincident,sc_req_item,change_request,problem^NQsys_class_name=change_request^state!=-1
The ^NQ operator starts a new OR-grouped condition block. Everything before it is one condition group; everything after is a separate group evaluated independently. This is what allows you to add a change-specific state exclusion without accidentally applying it to incidents or problems.
Where the Task Report Falls Short
The single Task report works for volume counts. It does not work well for:
- State-specific breakdowns: if you need to separate "New" incidents from "In Progress" ones, you are back to per-table state logic, which means per-table reports
- SLA compliance in the same view: joining Task-SLA multiplies rows and the counts become unreliable
- Dot-walking to child-table fields: sys_class_name.change_risk works for change records but returns empty for other types, which is confusing in a shared executive-facing view
For these use cases, separate reports per task type aggregated in a dashboard are more reliable than a single merged report.
The Right Answer: A Performance Analytics Dashboard
The cleanest production approach is a Performance Analytics (PA) dashboard with individual widgets per task type, sharing a common filter. This avoids cross-table state ambiguity while still presenting a unified view to leadership.
What this means in practice:
Each widget in the dashboard targets one task type: one for Incident, one for RITM, one for Change Request, one for Problem. Each widget uses that table's correct state logic. A shared assignment_group filter at the dashboard level applies to all widgets simultaneously, so filtering by team updates the whole view at once.
Prerequisites:
- The Performance Analytics plugin must be active on your instance (it is included in most ITSM packages but requires activation)
- Users viewing the dashboard need the pa_viewer role at minimum
Setting up a widget:
- Navigate to Performance Analytics > Dashboards > New
- Add a widget using the Score or Breakdown widget type
- Set the data source to a PA Indicator built on the relevant task table (e.g., Incident with active=true and the correct state range). If you have not built PA Indicators before, ServiceNow's Performance Analytics documentation covers Indicator creation as a prerequisite. It is a one-time setup per task type.
- Add a shared filter for assignment_group across all widgets using the dashboard filter configuration
Why this beats the single Task report:
PA widgets can share filter values without sharing a query. That means each widget uses the right data model for its type, and the dashboard still behaves like a single unified view. You also get trend lines and historical comparison out of the box, which a standard Report cannot provide.
Handling Task-SLA in Unified Reports
Task-SLA [task_sla] is a child table linked to the parent task record. Each task can have multiple SLA records: one for time to resolve, one for time to first response, and any custom SLAs configured for that task type.
Joining Task-SLA directly into a task report multiplies rows. The right approach: report on SLA compliance separately per task type, and link to those reports from the unified dashboard rather than embedding SLA data in the open work view.
If you genuinely need SLA status in the unified view, add a calculated field or use a Report condition that checks the most recent Task-SLA record per task, rather than joining the full set.
Common Pitfalls That Skew the Numbers
- Filtering state=1 across all task types: the value is not universal. Use active=true instead.
- Joining Task-SLA in the same report: row counts become misleading. Aggregate at the task level.
- Using string matching on state labels: labels can be customized per instance. Filter on integer values or boolean flags, not display values.
- Mixing REQ and RITM: they count different things. Pick one based on what "open request work" means for your team.
- Including cancelled or closed records by accident: add an explicit active=true condition and verify it applies to all four task types in your instance.
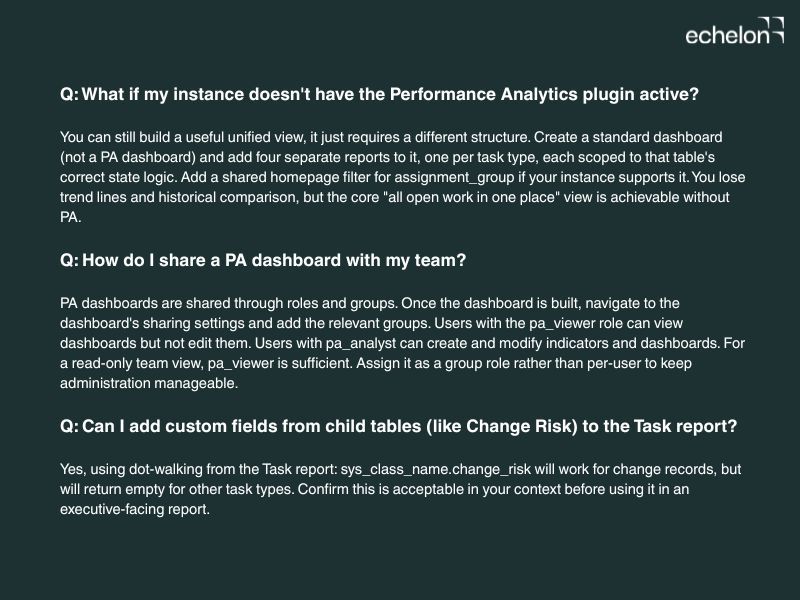
Frequently Asked Questions
When to Use Each Approach
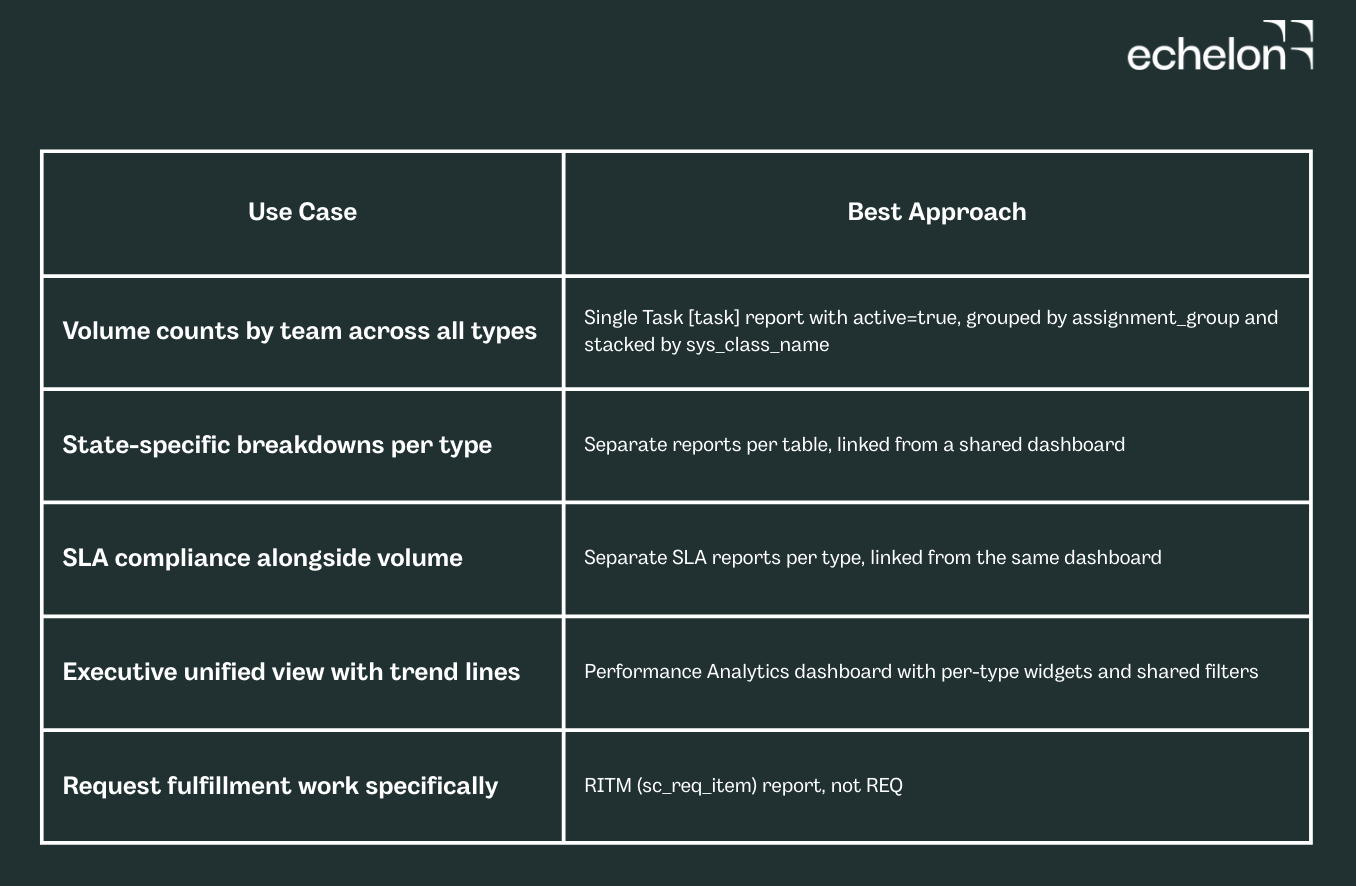
For most teams, the PA dashboard approach is the right starting point. If your scope is just a count by team, the single Task report works fine and is faster to set up. If you need SLA compliance alongside volume, keep those as separate linked reports. Combining them will cost you accurate row counts.
Related Articles

Most ServiceNow upgrade failures are caused not by major custom applications but by forgotten business rules, dictionary overrides, and cloned scheduled jobs that nobody documented. This guide shows how to query sys_metadata to build a complete customization inventory, score each item by upgrade risk, and build a proportional test plan before your next Yokohama or Zurich upgrade.

Skip expensive SPM licenses. Build lightweight demand management in ServiceNow with a custom table, 3-question scoring model, and weekly triage cadence. This 2-week implementation guide shows you how to capture requests consistently, prioritize fairly, and integrate with Jira, no additional licensing required. Perfect for platform teams managing under 50 concurrent projects who need visibility without six-figure portfolio tools.

Reddit's ServiceNow community reveals what experienced admins wish they knew before standing up their first instance in 2026. From CMDB setup to fighting customization creep, learn the best practices that matter and how AI agents are compressing 12-16 week implementation timelines to days.